Data and Information Explained for Students
Published: 3 Sep 2025
We live in a world full of facts, numbers, and messages. Every time we open our smartphones, use a computer, or even watch TV, something is being collected, shared, or saved. At school, in offices, and even at home, people are using computers to handle so many things.
Behind all of this are two important things: data and information. They play a big role in how we understand and use the world around us.

In this article, we’ll explore data and information.
What is Data?
Data means raw facts or details that we collect from the world around us. These facts have no clear meaning on their own. Data can be numbers, words, symbols, pictures, sounds, or anything else we can record or measure.
It is unorganized and unprocessed, which means it doesn’t explain anything by itself. We need to arrange or study the data to understand it. Only then can it become useful.
Example
Here are some examples of data given below.
- “Blue, 5.6, Yes, 202.” This is just a list of items. We don’t know what they mean.
- A list of temperatures: “30°C, 32°C, 29°C”
- A survey result: “Male, 18 years, Likes sports.”
These examples show pieces of data, but they don’t tell a complete story yet.
Think of data like ingredients in a kitchen. On their own, flour, sugar, and eggs don’t mean much. But when you mix them properly, you can bake a cake. Just like that, data becomes useful only when we process it.
Features
Here are some features of data.
- Data gives us facts, but not meaning
- Data can be in the form of numbers, text, images, or sounds
- We need to process data to get information
- Data is the starting point of all work in computers
Types of Data
There are two main types of data.
- Quantitative data
- Qualitative data
Let’s talk about them in detail.
Quantitative Data
Quantitative data is numerical data that shows amounts, counts, or measurements. It tells us how much, how many, or how often something happens using numbers.
Examples
Here are some examples of quantitative data.
- Age: 7 years
- Height: 150 cm
- Time: 2 hours
These examples give exact amounts; they are not just descriptions but measurable facts.
Features
Let’s look at some features of quantitative data.
- It always uses numbers.
- We can count or measure it.
- It gives clear and exact answers.
Types of Quantitative Data
There are two types of quantitative data.
- Discrete Data: This data includes whole numbers. We count it in steps. For example, the Number of books, the number of students.
- Continuous Data: This data includes numbers we can measure. It can have decimals. For example, your height, the weight of a bag, or the temperature.
Let’s look at another type of data.
Qualitative Data
Qualitative data is descriptive data that explains qualities, characteristics, or opinions using words instead of numbers. It helps us understand how something looks, feels, or behaves.
Examples
Here are some examples of qualitative data.
- Mood: Happy, Sad, Angry
- Color: Red, Green, Yellow
- Review: Boring, Funny, Exciting
All of these give us useful details, but no numbers are involved.
Features
Let’s look at some features of qualitative data.
- It uses words, not numbers.
- It describes qualities or features.
- We cannot count it.
Types of Qualitative Data
There are two types of qualitative data.
- Nominal Data: This data has names or labels. We cannot arrange it in any order. For example, Eye color, country name, and favorite fruit.
- Ordinal Data: This data shows order or rank, but not the exact difference between them. For example, first, second, and third place in a race. Feelings like happy, very happy, or sad.
Information
Information means the result we get after processing and organizing data. It gives us a clear meaning and helps us understand something properly. When we arrange raw facts in a useful way, they turn into information that we can use to make decisions or learn new things.
Information is always meaningful, while data is just random facts. Without information, we cannot understand what data is trying to tell us. So, information is the final output that gives value to the collected data.
Examples
Here are some examples of information.
- The temperature for the week was between 29°C and 32°C.
- A survey shows that 70% of boys aged 18 like sports.
- The item with code 202 is a blue water bottle that costs $5.60.
These examples show organized and meaningful data, which helps us understand something clearly.
Think of information like a finished dish. The raw ingredients (data) are useless until cooked. Once you cook them the right way, you get a tasty meal (information). In the same way, when we process data, we get useful information.
Features
Let’s look at some features of information.
- Information gives meaning to data.
- It helps us understand and decide things.
- It is clear and easy to read.
- We get it after we sort and check the data.
Types of Information
There are different types of information based on how we use it.
- Statistical Information
- Descriptive Information
- Visual Information
- Textual Information
Let’s talk about them in detail.
Statistical Information
Statistical information is number-based data that shows results in the form of counts, averages, or percentages. It helps us understand facts by using figures that we can measure and compare.
Examples
Here are some examples of statistical information.
- Marks: 85 out of 100
- Height: 150 cm
- Survey: 60% of people like tea
- All of these give us useful details using numbers we can measure.
Features
Let’s look at some features of statistical information.
- It uses numbers, not words.
- It shows results through counting or measuring.
- We can easily compare it using charts or tables.
Let’s look at another type of information.
Descriptive Information
Descriptive information is word-based data that explains something using detailed sentences or short descriptions. It helps us understand how a person, place, or thing looks or behaves by giving clear details.
Examples
Here are some examples of descriptive information.
- The dress is red with white flowers.
- The dog is friendly and playful.
- The room was dark and quiet.
All of these give us useful details using words, not numbers.
Features
Let’s look at some features of descriptive information.
- It uses full sentences or phrases.
- It gives a clear picture through words.
- We cannot count or measure it.
Let’s look at another type of information.
Visual Information
Visual information is data that is shown using images, charts, symbols, or videos instead of words or numbers. It helps us understand something quickly by looking at pictures or graphics.
Examples
Here are some examples of visual information.
- A pie chart showing favorite fruits.
- A photo of a school event.
- A road sign with a red stop symbol.
- All of these give us useful details through visuals, not text.
Features
Let’s look at some features of visual information.
- It uses pictures or graphics.
- It is easy to understand at a glance.
- We don’t need to read or count it.
Let’s look at another type of information.
Textual Information
Textual information is data that is shared using written words, sentences, or paragraphs. It helps us understand something by reading detailed content like articles, reports, or notes.
Examples
Here are some examples of textual information.
- A news report about the weather.
- A school assignment in paragraph form.
- An email with instructions.
- All of these give us useful details through written text.
Features
Let’s look at some features of textual information.
- It uses written sentences and paragraphs.
- It gives detailed explanations.
- We need to read it to understand the message.
How Data Turns Into Information?
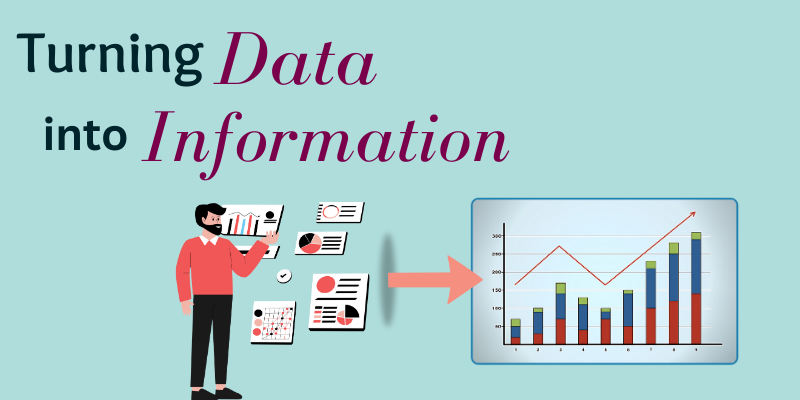
Data becomes information when we process and arrange it in a way that gives it meaning. Without proper steps, data stays unorganized and doesn’t help us understand anything.

Here’s how data turns into information:
- Collection: Gather raw facts from surveys, sensors, or observations.
- Organization: Arrange the data in a proper format, like lists or tables.
- Checking: Remove mistakes and make sure the data is correct.
- Analysis: Study the data to find patterns or useful details.
- Presentation: Show the results in a clear way, like charts or sentences.
Conclusion
In this article, we’ve learned about the data and information. Data and information are important parts of how computers work. Data is raw, unorganized facts, while information is the clear result after the computer processes that data.
We use information to make decisions, solve problems, and understand things better. When you know the difference between data and information, you can use computers more smartly and work more effectively.
Now that you understand data and information, keep learning to turn simple facts into powerful knowledge!
I hope this information is helpful to you. Share your feedback in the comment section.
FAQs
Got questions about data and information? Find the answers in the FAQs below!
Yes, you can turn data into information by organizing and analyzing it in a meaningful way. When you understand what the data shows, it becomes useful information.
Information is more useful because it gives clear meaning and helps in decision-making. Data is important too, but it needs to be processed to become useful.
No, information is not always correct because it depends on the accuracy of the data used. If the data is wrong, the information will also be incorrect.
Yes, we need both data and information in school projects. Data supports your research, and information explains your findings in a clear and useful way.
No, a sensor cannot collect information directly; it only collects raw data like temperature or speed. That data must be processed to turn into information.
No, not all data is digital. Data can also be written on paper, recorded in sound, or stored in physical forms like books or photos.
No, more data doesn’t always mean better information. Only well-organized and accurate data leads to useful and clear information.
No, information cannot exist without people because we give meaning to data. Without someone to understand or interpret it, data remains just raw facts.
No, data is not only used in technology. We use data in everyday life, like in education, health, business, and even cooking or shopping.
You can learn to manage data better by organizing it clearly, using tools like tables or spreadsheets, and practicing how to analyze and understand patterns in the data.

- Be Respectful
- Stay Relevant
- Stay Positive
- True Feedback
- Encourage Discussion
- Avoid Spamming
- No Fake News
- Don't Copy-Paste
- No Personal Attacks

- Be Respectful
- Stay Relevant
- Stay Positive
- True Feedback
- Encourage Discussion
- Avoid Spamming
- No Fake News
- Don't Copy-Paste
- No Personal Attacks


